It is very important to understand the options chain and let’s deep dive into few of the important information that we can gather from this options chain.
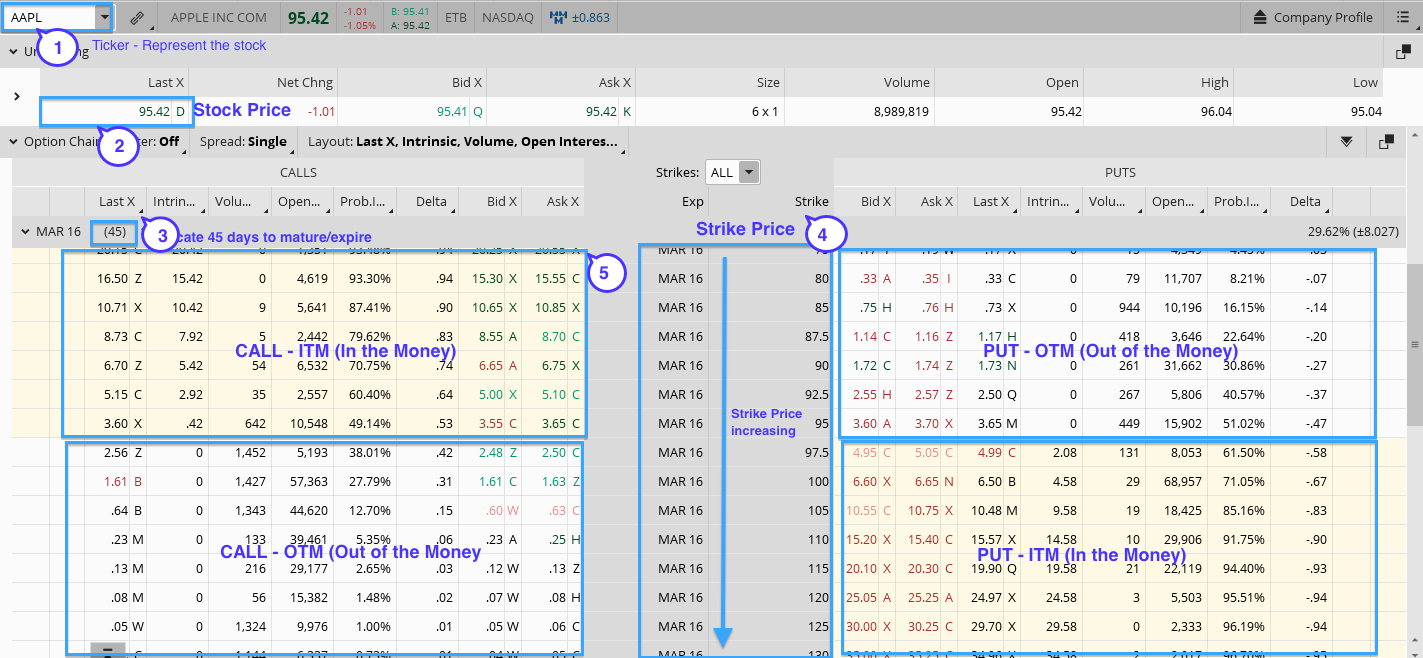
1. AAPL – this is a ticker, represents the stock that we are keen to trade
2. Last Price of the AAPL – it shows $95.42, the price that AAPL stock is traded at the time of snapshot.
3. Days to expiration – it shows 45 days to expiration, inclusive of weekend and holiday. Do note that every options has the maturity date and this info shows the length of days to mature.
4. Strike Price – This is the price that will determine if options will expire or exercised on maturity day, which is when #3 = 0 days.
5. Options chain – There are 4 quadrants:-
a) CALL ITM – Represented by the top left quadrant (shaded in yellow), the strike price is < last price, #2 (Have both intrinsic value and time value)
b) CALL OTM – Represented by the bottom left quadrant (shaded in white), the strike price is > last price, #2 (No intrinsic value, only time value)
c) PUT OTM – Represented by the top right quadrant (shaded in yellow), the strike price is < last price, #2 (Have both intrinsic value and time value)
d) PUT ITM – Represented by the bottom right quadrant (shaded in white), the strike price is > last price, #2 (No intrinsic value, only time value)