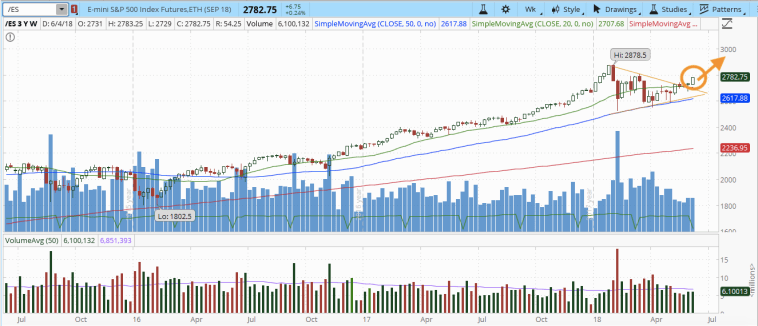
S&P 500 futures broke the symmetrical triangle decisively after few weeks of side way movement. Trader can wait for the pullback to 20-SMA to initiate a long position.
Crude oil futures pulled back to $65.56 after hitting a recent high at $72.9. Trader can still hold the position as the 20SMA and weekly support trendline are still defending well. Trader should liquidate the position if both supports are broken.

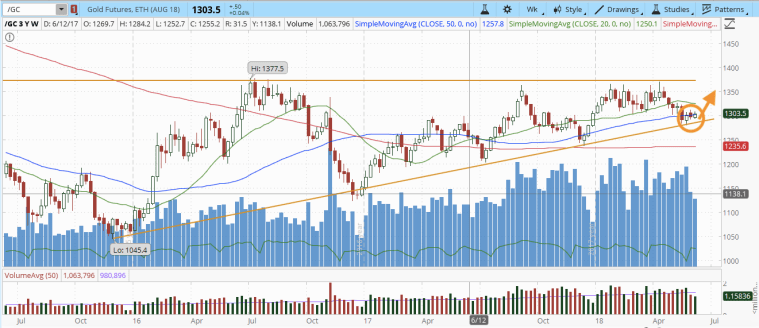
Gold futures ended at $1303.5. After hitting $1281 (support trendline) few weeks ago, the index trended slightly upward by ending the subsequent weeks in higher low. The upside is favourable with high probability.
Suggestion: Options trader can consider to initiate bull put spread at 1300 (Put side) & 1290 (Call side) using Aug18 contract.

One thought on “Weekly Review 4 – 8 Jun 2018 (Stock, Gold, Crude Oil markets) – Part 1”