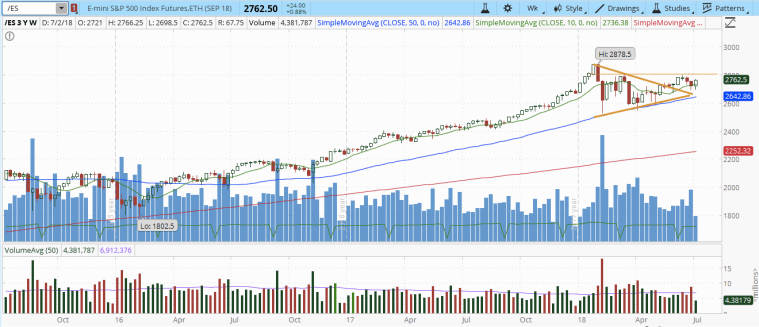
S&P 500 futures ended the week at 2762.50, above 10 week SMA (green line) with a greater hope of protruding the intermediate resistance at 2806 (horizontal orange line). Continue to suggest trader to stay at sideline until a more obvious trend is formed. Option trader who has the iron condor position at 2600- (put side) and 2800- (call side) can continue to hold the position and reap the benefit of the decaying time value. Do get ready to react and adjust the position if the resistance at 2806 is broken next week.
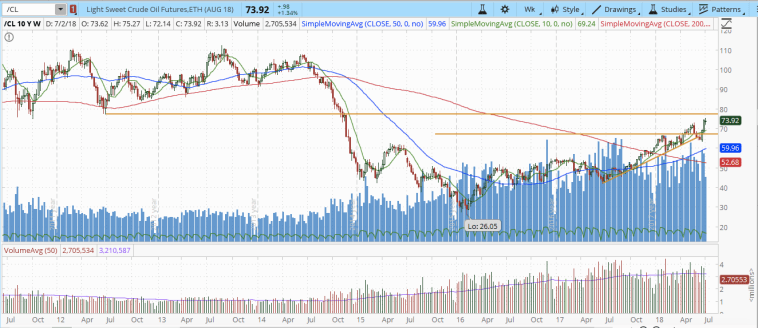
Crude oil futures formed a doji weekly candlestick. As the next resistance is somewhere at 77.3 region, suggest trader to stay at sideline at the moment.
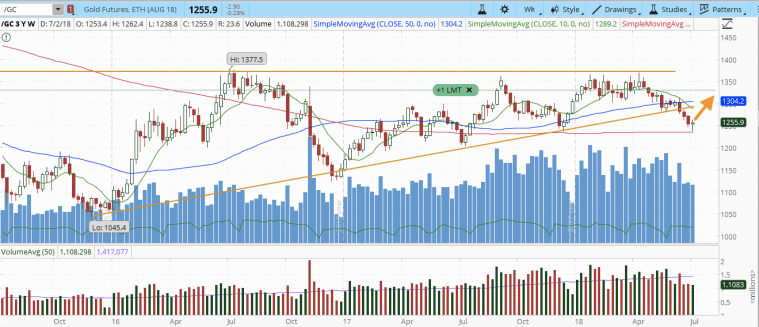
Gold futures formed a hammer after bouncing off the 200 weekly SMA. Option trader who initiated the position last week should be making good unrealised profit if still holding on to the position. The probability of the futures to go higher this week is high. It should be a low risk high probability trade to long gold futures at the current price at around 1256, with the stop loss at 1230 (Losing 26 pts) and target profit at 1350 (Making 96 pts).

One thought on “Weekly Review 2– 6 Jul 2018 (Stock, Gold, Crude Oil markets)”