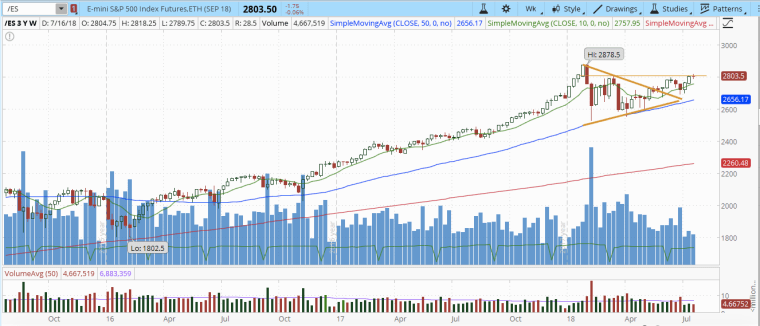
S&P 500 futures formed a weekly doji candlestick pattern after a strong uptrend on the previous week. Doji near resistance is not desirable. However, it just indicates that there is a halt/rest or undecided direction. It doesn’t mean that a bearish reversal will follow for sure. The upcoming week earning news and trade war development should determine the direction of the market. Suggest to wait patiently before a more obvious trend is formed.
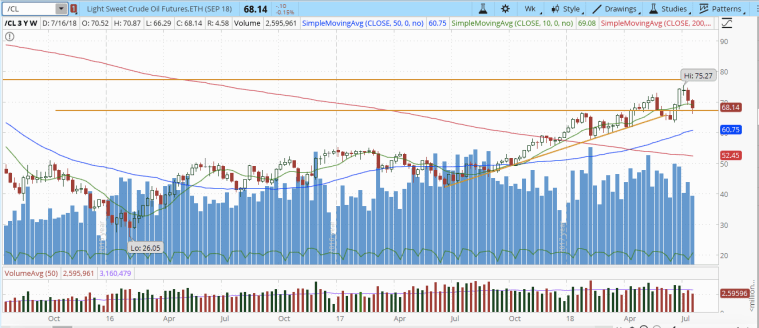
Crude oil futures continue to decline and broke the 10 weekly SMA but ended the week above the support line (orange line). Option trader who sold iron condor last week should continue to hold on to the position. Uptrend is not yet broken as long as 50 weekly SMA is still holding tight.
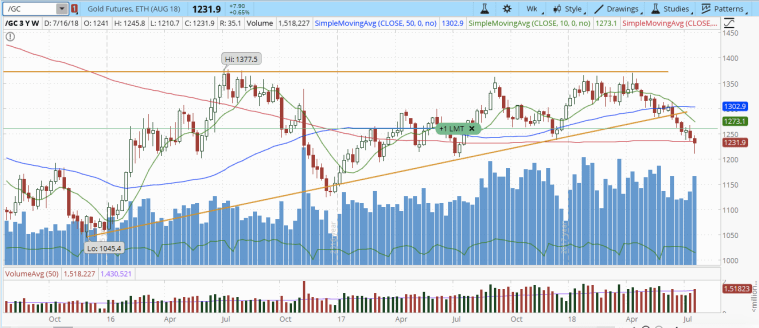
Gold futures continue to drop and broke 200 weekly SMA during mid week. Option traders who initiated the position three weeks ago week should still be making a slight unrealised profit or break-even if still holding on to the position even thought the direction of the price went against them. This is because the time decay works for the options seller. As for the traders who long gold futures should have stopped out during the mid week. If reversal happens in the upcoming week and if another low risk high probability chance arises, do tap into it!
Trader mindset #2 – We can loss 9 games in a row but still can come out unscratched by winning the 10th game if our trading skill is potent!
